Suggested Research Articles
2022 Journal Publications:
Ilia, A. A. Cifuentes-Lorenzen, G. McCardell, T. Fake, J. O’Donnell (2022) Wave Growth and Dissipation in a Fetch-Limited Urban Estuary: Long Island Sound. Coastal Eng. (Submitted - stay tuned for publication)
Ilia, A., G.McCardell, M. Howard Strobel, and J. O’Donnell. (2022) Observations of Autumnal Cooling in a Large Estuary. J. Geophys. Res. Oceans (Accepted - stay tuned for publication)
McCardell, G., R.M. Horwitz, A. Ilia, M. Howard-Strobel, T.A. Fake, and J. O’Donnell (2022). Heat flux estimates from a synthesis of satellite observations and a hydrodynamic model (with application to Long Island Sound). J. Geophys. Res. Oceans (Accepted, preview at https://doi.org/10.1002/essoar.10511427.1)
Pais, N., N. Ravishanker, J. O’Donnell, and E. Shaffer, (2022). Ensemble Backcasting of Wave Heights in the Long Island Sound. . J. Geophys. Res. Oceans (Submitted - stay tuned for publication)
Modeling nearshore dynamics of extreme storms in complex environments of Connecticut. C. Liu, Y. Onat, Y. Jia and J. O'Donnell. June 2021.
- This paper describes a high resolution wave and circulation model application in Branford, Norwalk, and New Haven, CT. We compared the model results with the FEMA base flood elevation, the North Atlantic Coast Comprehensive Study (NACCS), and (Liu et al., 2020)’s Long Island Sound FVCOM-SWAVE model, also considering sea level rise.
Waves in Western Long Island Sound: A Fetch‐limited Coastal Basin. Y. Shin, A. Cifuentes‐Lorenzen, MM. Howard Strobel, and J. O'Donnell. Journal of Coastal Hydrology and Oceanography. January 2021.
- This paper summarizes the statistics of observations of wind and surface gravity waves in Long Island Sound. Researchers examine the relationship between significant wave height and wind speed and direction and show that the significant wave height and dominant period in western Long Island Sound have an asymmetric response to the wind direction.
Impact of Compound Flood Event on Coastal Critical Infrastructures Considering Current and Future Climate. Mariam Khanam, Giulia Sofia, Marika Koukoula, Rehenuma Lazin, Efthymios I. Nikolopoulos, Xinyi Shen, and Emmanouil N. Anagnostou. Journal of Natural Hazards and Earth System Sciences. February 2021.
- This paper examines case studies of compound flood hazards affecting critical infrastructure in coastal Connecticut. Seven coastal river reaches were studied where eight power grid substations lie in proximity to riverbanks and are prone to flooding caused by coastal storms (such as hurricanes) that combine heavy precipitation and high surge.
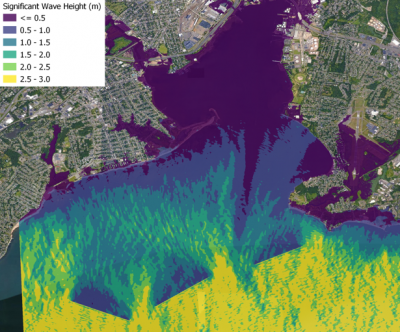
Estimating the Annual Exceedance Probability of Water Levels and Wave Heights from High Resolution Coupled Wave-Circulation Models in Long Island Sound. Chang Liu, Yan Jia, Yaprak Onat, Alejandro Cifuentes-Lorenzen, Amin Ilia, Grant McCardell, Todd Fake, and James O’Donnell. Journal of Marine Science and Engineering. June 2020.
- Accurately estimating the probability of storm surge occurrences is necessary for flood risk assessments. The results of floodwater elevations and significant wave heights for four types of storms show that both water levels and their corresponding return intervals are higher along the western coast of Connecticut than the eastern coast, whereas significant wave heights increase eastward.
An Assessment of Two Models of Wave Propagation in an Estuary Protected by Breakwaters. Amin Ilia and James O'Donnell. Journal of Marine Science and Engineering. July 2018.
- Breakwaters influence coastal wave climate and circulation by blocking and dissipating wave energy. In a large harbor, these effects are combined with wave generation, refraction and reflection. In this study, researchers used available observations to evaluate the accuracy of model simulations of waves in New Haven Harbor, Connecticut, an estuary with three detached breakwaters near the mouth.
Connecticut Sea Level Rise
Measurements of sea level by instruments in the water and satellite altimeters provide unambiguous evidence that the annual mean level of the ocean surface is rising. Coastal communities should expect that the frequency of coastal flooding will increase.
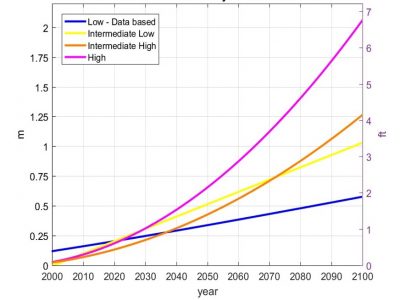
In 2012 NOAA released global sea level rise scenarios that were referenced in Connecticut state statute requiring that sea level rise be considered in state and local plans of conservation and development and natural hazard mitigation plans. NOAA report CPO-1 (Parris et al. 2012) provided four projections on sea level rise scenarios. That same statute charged UConn CIRCA with updating the scenarios to be local for the state of Connecticut. To provide more local guidance for Connecticut Sea Level Rise in Connecticut, CIRCA Executive Director and Professor of Marine Sciences, James O’Donnell authored the report, finalized in January 2019.
“Connecticut plan for the upper end of the range of values projected of sea level rise or up to 20 inches (1 foot 8 inches) of sea level rise higher than the national tidal datum in Long Island Sound by 2050 and that it is likely that sea level will continue to rise after that date.”
CIRCA has reviewed and modified the projections to include the effects of local oceanographic conditions, more recent data and models, and local land motion. A concise summary of the results are shown in Figure 1.
The Institute also recommended that the scenarios be updated at least every 10 years, or more frequently, to incorporate the best available science and new observations.
Modeling Nearshore Dynamics of Extreme Storms in Complex Environments of Connecticut
Flood hazard planning requires the accurate estimation of total water elevation due to predicted tide, surge, and wave runup to design flood protection structures and improve coastal risk planning for severe storms. The beach topography and nearshore hydrodynamic conditions impact the conclusive flood inundation mapping in complex environments. The conventional approaches of flood modeling are limited due to either i) simple static estimates, ii) the application of a coupled circulation and phase-averaged wave models in coarse resolution, iii) failing to calibrate and validate with in-situ data, or iv) not considering sea-level rise projections in mapping the flood extent. We used a high-resolution wave model (FUNWAVE-TVD) capable of resolving processes like wave refraction and diffraction on the nearshore area to determine total water elevation on the shores.
The results presented here are high-resolution numerical model results validated with in-situ measurements to resolve wave height and storm surge levels along the coastal towns to guide the engineering adaptation and planning efforts. The results are also compared with commonly used coarser models like North Atlantic Coastal Comprehensive Study and FEMA base flood elevations.
To learn more about this project, read an article published in 2021 in the journal Coastal Engineering and view a poster that received a second place award at the 2021 NEARC Conference!
Connecticut Coastal Towns Storm Surge Annual Exceedance Probability (Return Interval) Viewer
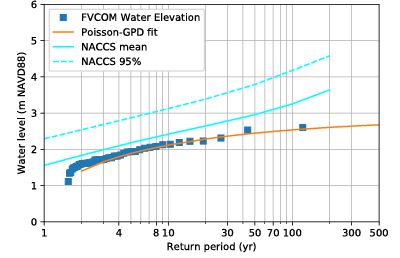
Understanding the risk posed by extreme storm events and accurate assessment of the flood risk is crucial for the successful management of the coastal communities using increasing resiliency. There are only a few available tide gauge, buoy, and storm sensor data in the Long Island Sound to project the extreme sea level statistics using the observed records available to determine the level of risk along the Connecticut coastline accurately. In this work, we reproduced the highest 44 storms between 1950-2018 using a coupled circulation and wave model. The modeled events are fit to a probability distribution to statistically estimate the annual exceedance probabilities and return periods for expected storms.
The results presented here are to highlight the storm surge water levels and significant wave heights, which may contribute to a better understanding of extreme storms and guide decision-makers.
“The probability of the occurrence of the events increases with the added 20 inc local sea-level rise projections for 2050. The 10% annual probability (10-year return period) increases approximately to 50% (2-year return period), and 1% annual probability (100-year return period) increases approximately to 5% (20-year return period). The climate change impacts on the storm characteristics and sea-level rise should be considered to plan coastal projects.”
Connecticut Coastal Towns Vulnerability Assessment
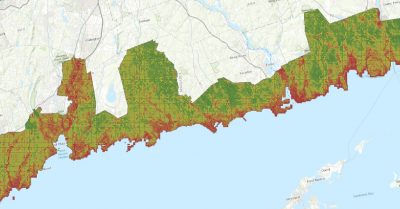
Considering that local, regional, and global conditions strongly determine coastal processes and vulnerability, a good understanding of the physical, biological and social system characteristics is required, as well as climatological and hydrological data. The project is a science-based regional risk assessment that will inform the regional initiatives on adaptation priorities and spatial aspects of the coastal system response to sea-level rise. The purpose of this study is to establish resilient coastal communities through coastal vulnerability assessment that incorporates the vulnerable regions to the coastal flooding concerning the biophysical and socio-economical perspective.
The project developed a methodology to identify zones that face common challenges to climate change, and that have shared priorities in terms of coastal resilience. GIS supported index-based approach is useful to analyze in multi-scale and multi-criteria both interactively and express an overlapped one-dimensional risk index. The coastal vulnerability index demonstrates the vulnerable regions to the coastal flooding concerning the biophysical and socio-economical perspective. The index gives a relative sense of zones that are more susceptible to exposure and identify places that need to develop adaptation measures to cope with the effects of future climate scenarios.
“The coastal vulnerability mapping is proposed to identify the areas that are more susceptible to its surrounding region. This approach provides a framework for regional, municipal, and site scale planning to tackle the challenges of future sea-level rise flooding.”
Connecticut Legislation
CIRCA's final report provides the basis for sea level rise projections in Governor's Bill S.B. 7, which was introduced into the 2018 legislative session and was enacted into law as Public Act 18-82.
Senate Bill No. 7, Public Act No. 18-82
AN ACT CONCERNING CLIMATE CHANGE PLANNING AND RESILIENCY.
Substitute Senate Bill No. 9, Public Act No. 18-50
AN ACT CONCERNING CONNECTICUT’S ENERGY FUTURE.
Waves in Long Island Sound: NOAA CREST Project
The goal of the research was to numerically resolve sea dynamics (such as currents, waves, sea surface displacement) at the Connecticut coastline. The estuarine circulation of the LIS mediates key biogeochemical cycles (cycles in which chemical elements and simple substances are transferred between living systems and the environment) in the region upon which local environments depend. Understanding local changes in the wave field and circulation dynamics in the LIS goes beyond purely scientific endeavors, with future implications that effect coastal communities and the natural environments. Currently, there is particular attention being placed into evaluating the risk of flooding at coastal areas as the upcoming and present challenges of climate change at a regional scale become apparent with changes in sea level and storm frequency and intensity. This work will help coastal communities better understand the effect of waves at the coastline – where people live, work, and play.
“We have modeled a set of storms that have affected the region in recent years for five locations – Hurricane Gloria, Super Storm Sandy, Hurricane Irene (2011), Nor’easter of 2015, and several strong Nor’easters. Focusing on key wave statistics such as the significant wave height and the dominant wave period.”
The model corresponds to the Finite Volume Community Ocean Model (FVCOM) and uses a 3-D unstructured grid-free surface and primitive equations to calculate the hydrodynamics. The model also combines the circulation model with a wave module as well as radiation stresses, the bottom boundary layer, and surface stress.
The point of records
The results of a wave model at five locations along the Connecticut shoreline are reported below.
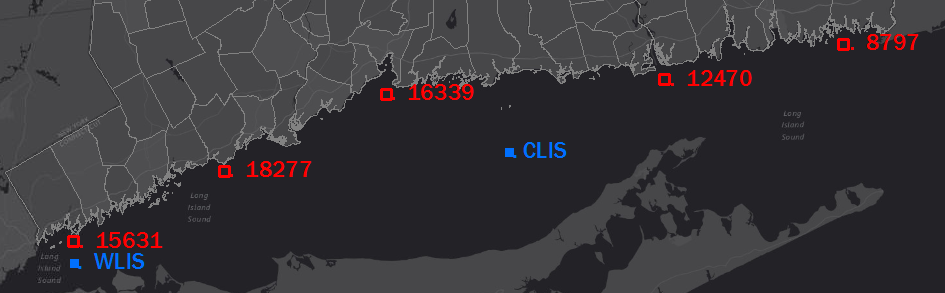
Visit the buoys page for more information about the WLIS and CLIS buoys.
Wave information can be provided for any point in Long Island Sound or along its coastline. Please contact james.odonnell@uconn.edu to get additional data points.
| Point ID | Depth (m) | Latitude | Longitude |
| 15631 | 13.136 | 40.991 | -73.582 |
| 18277 | 14.292 | 41.106 | -73.262 |
| 16339 | 6.244 | 41.232 | -72.918 |
| 12470 | 6.932 | 41.254 | -72.324 |
| 8797 | 11.423 | 41.309 | -71.941 |
The project is still undergoing to increase the number of data points.
References
- U.S. Department of Commerce. National Oceanic and Atmospheric Administration. .pdf Sea Level Rise and Nuisance Flood Frequency Changes around the United States.pdf, by William Sweet et al., Technical Report NOS CO-OPS 073, NOAA. Silver Spring, MD, 2014.
- “Summary of PA 13-179—sSB 1012: An Act Concerning The Permitting of Certain Coastal Structures By The Department of Energy and Environmental Protection” Last modified June 21, 2016.
- CIRCA local sea level rise projections: ODonnell 2017 Technical Report Executive Summary.pdf and Presentation (with audio) and slides only.pdf.
- CIRCA's blog, "Current Policies on Sea Level Rise in Connecticut"provides an overview of PA 13-179 and the NOAA CPO-1 report's global sea level rise projections.