Map Viewers
Resilient Connecticut Story Maps
Start with the Resilient CT Storymap for an overview of the program. Then explore the top Resilience Opportunity Areas (ROARs) by clicking on the story maps for the Council of Governments (COG) that have been involved in the Resilient Connecticut program. These ROARs were selected based on vulnerability assessments and stakeholder engagement to align with municipal and regional goals.
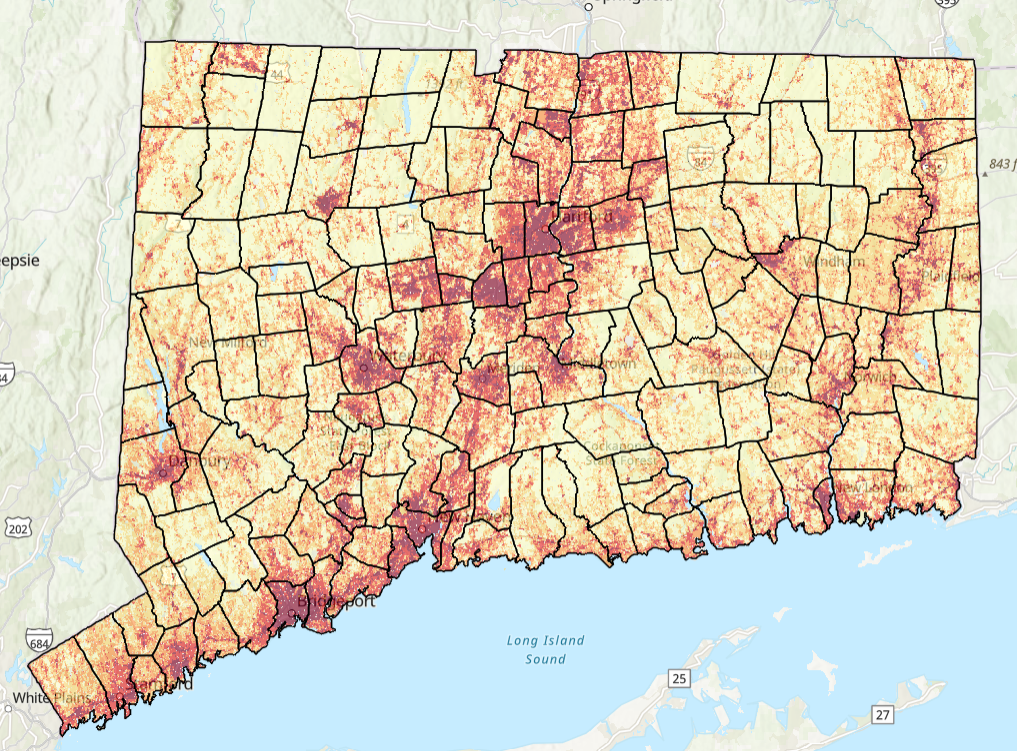
Climate Change Vulnerability Index (CCVI)
The Climate Change Vulnerability Index (CCVI) is a statewide mapping tool for flood and heat vulnerability that can be used, in conjunction with other resources, for planning and developing purposes. Additional CCVI resources include a factsheet, and webinars on the development and application of the tool.
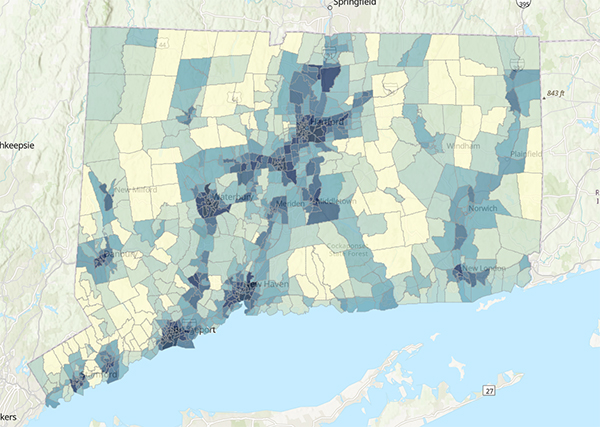
Connecticut Environmental Justice Screening Tool
Connecticut EJ Screening Tool is an interactive resource that combines both community and data-driven approach that incorporates environmental burdens and demographic indicators. This map allows users to explore the environmental health and the conditions (socioeconomic and or other distinguishing community characteristics) within a specific region, town, city, and or entire state.
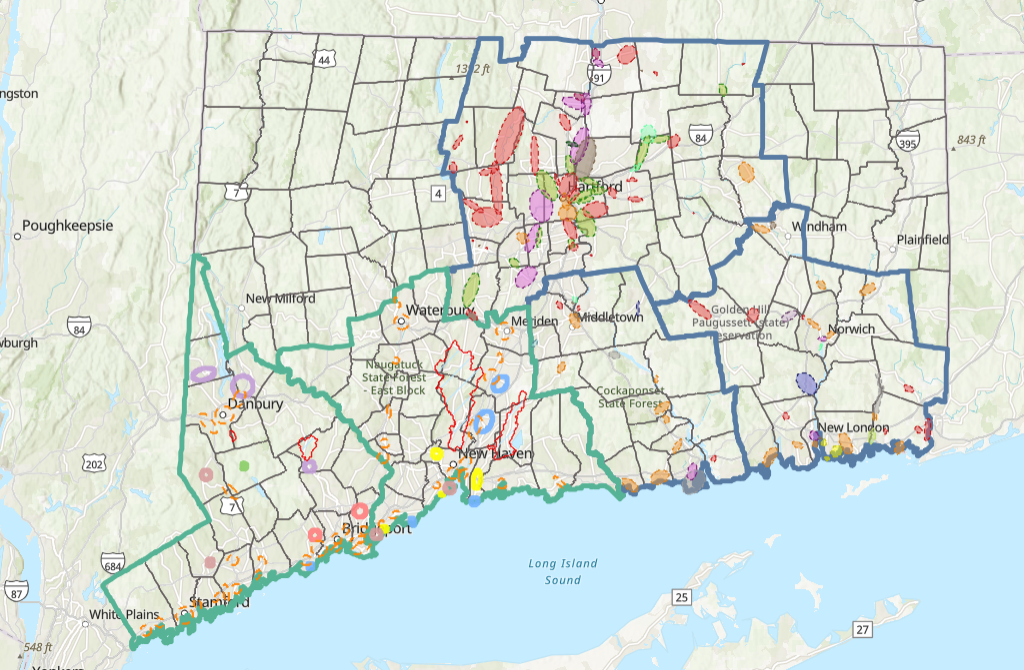
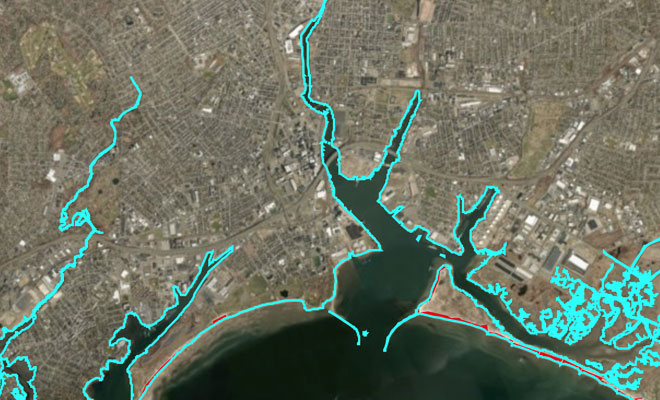
Zones of Shared Risk Viewer
View the Zones of Shared Risk (ZSR) for the Resilient CT program. Zones of shared risk are regions that face common challenges either in existence already or caused by climate change, and therefore risks are shared among or between groups of people that may have different perspectives and priorities for resilience.
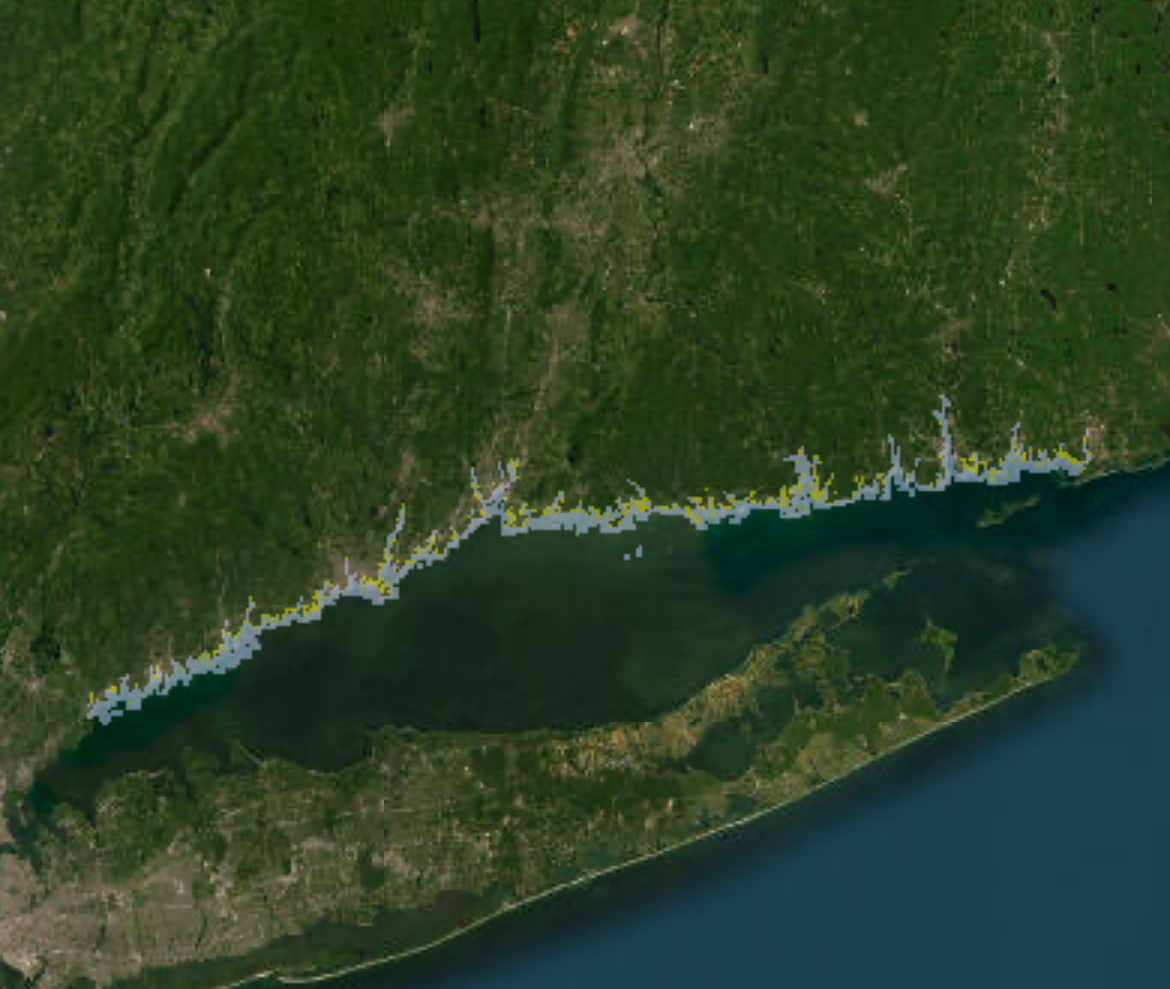
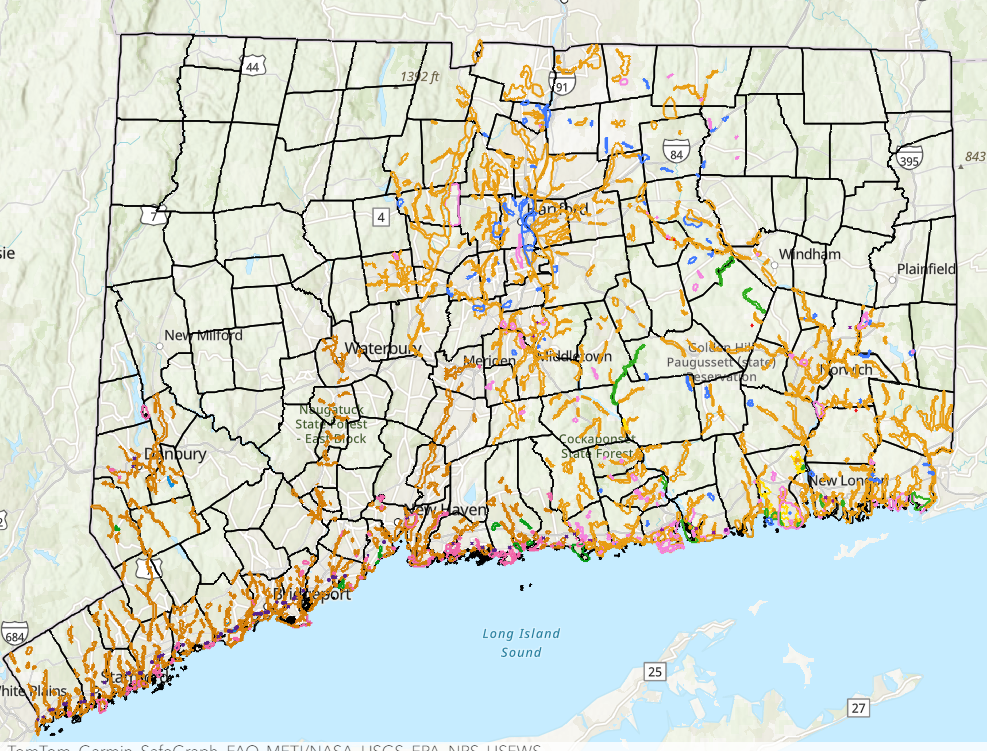
Connecticut Sea Level Rise and Storm Surge Viewer
This map and associated dataset shows different flood maps with return periods and sea-level rise projections above a Mean Higher High Water (MHHW) along the Connecticut coastline and the adjacent inland. CIRCA research recommends that planning anticipates sea level will be 20 inches higher than the national tidal datum in Long Island Sound by 2050. CIRCA’s report on Connecticut sea level rise provided the basis for projections in Bill S.B. 7, which was introduced into the 2018 legislative session and was enacted into law as Public Act 18-82.
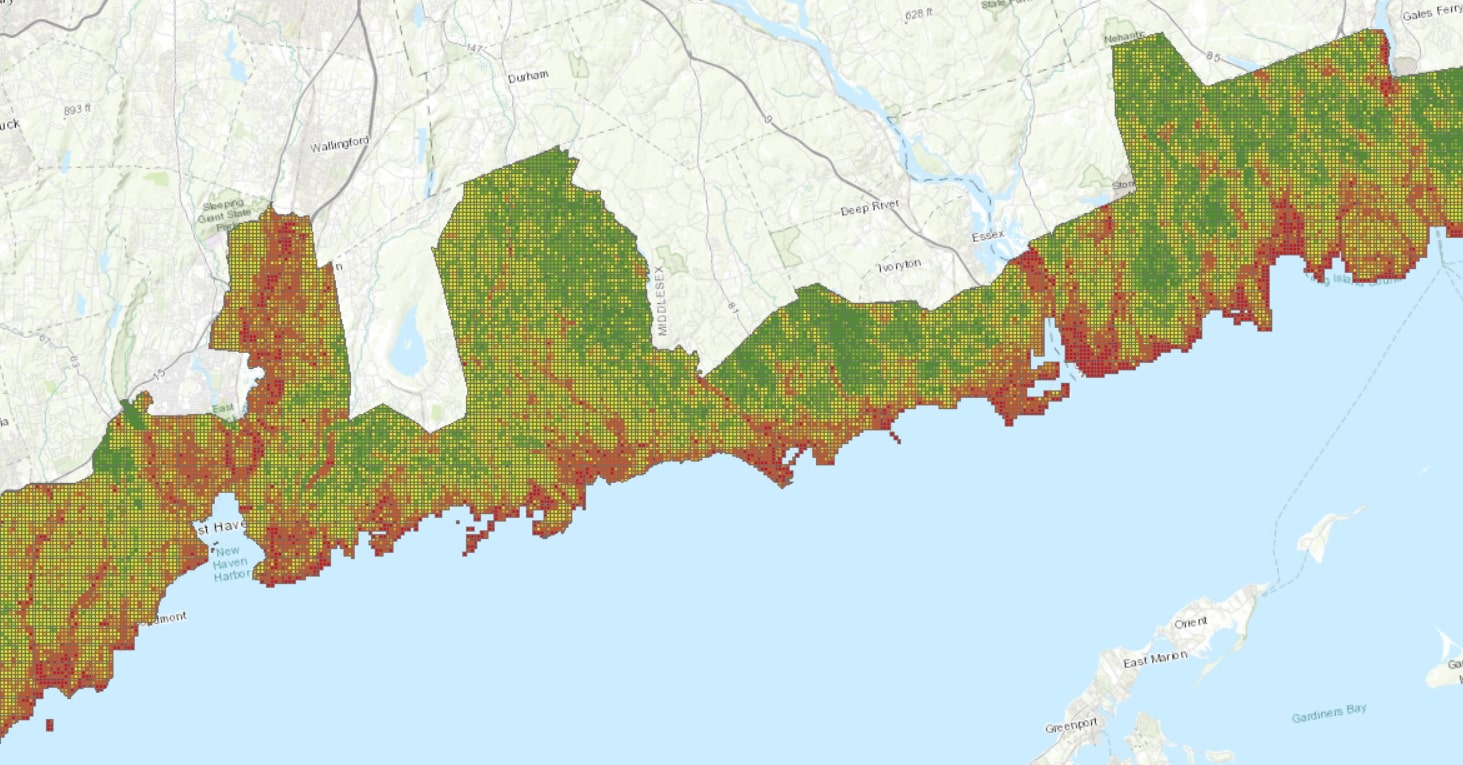
Coastal Vulnerability Index
This map viewer is a GIS based tool to express a one-dimensional, interactive risk index at multiple scales. The influence of different factors to the effects of sea level rise are incorporated to help users visualize the relationship between environmental, socio-economic, and built contributors in terms of exposure, sensitivity, and adaptive capacity at a range of locations. The tool indicates a high to low rank for coastal vulnerability from the impacts of sea level rise.
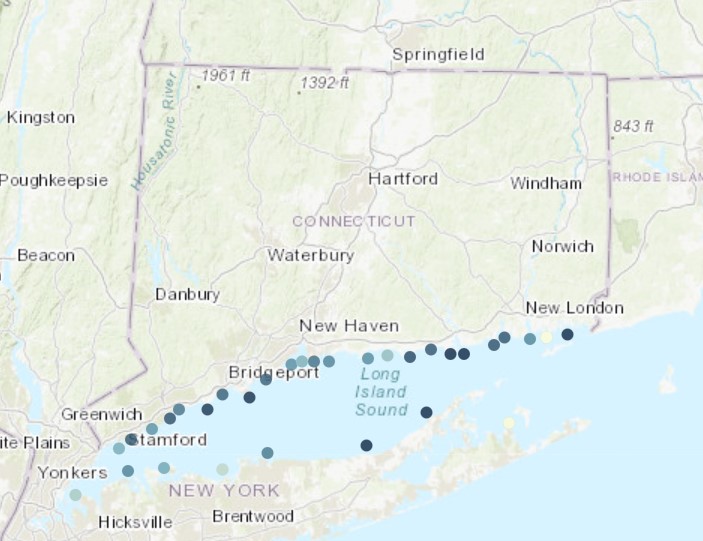
CREST Viewer
Five points distributed along the shoreline of Connecticut were chosen as locations for reporting results from the wave modeling work funded by a two-year grant from the National Oceanic and Atmospheric Administration (NOAA) to the University of Connecticut. There is a page for each point, 8797, 12470, 15631, 16339, 18277, as well as some information in the map when the point is clicked. The blue squares are two NOAA buoys. Learn more about the viewer legend.
Connecticut Coastal Towns Storm Annual Exceedance Probability/Return Interval Viewer
This map and associated dataset shows the annual exceedance probability (or return period) of storm surge water levels and significant wave height for each of Connecticut's 24 coastal towns obtained from coupled circulation-wave model (a recent Journal of Marine Science and Engineering article outlines this modeling approach). Results highlight storm surge water levels and significant wave heights, which may contribute to a better understanding of extreme storms and guide decision-makers.